
spect: Survival Prediction with Any Classifier
From late 2022 until 2025, my dissertation research focused on one question: can ordinary machine learning classifiers predict not just whether something happens, but when? The answer turned into an R package, spect (Survival Prediction Ensemble Classification Tool), which has been on CRAN since April 2025. The accompanying paper never made it into a journal, so this post is its home.
install.packages("spect")One important note before presenting my work - as I write this post in October 2026, I estimate that the years of work I did to build and deploy this package is something that a reasonably sharp graduate student with no prior experience in either machine learning or time-to-event anlysis could probably build with the help of Claude in about 4 weeks (Claude thinks it would take a little longer, but agrees with me that the quality of the code would be better). One the one hand, it definitely makes the work feel like a bit of a waste. On the other hand, what an amazing opportunity we have to advance the state of computer science, bioengineering, and medicine. Think about what years of work condensed into weeks could really mean. Of course, the opportunity extends far beyond those fields, but I’ll avoid commenting outside of my own scope of practice.
The Problem
Survival analysis, or time-to-event modeling, asks how long until something happens: a patient relapses, a machine fails, a customer cancels a subscription. The classic tools, like the Cox proportional hazards model, are statistical workhorses, but they make strong assumptions and aren’t really built for individualized predictions.
Machine learning classifiers are great at individualized predictions, but they answer yes/no questions. “Will this person cancel?” is a classification problem. “When will this person cancel?” isn’t, at least not directly. On top of that, survival data is full of censoring: people who leave the study, or simply haven’t had the event yet, so you don’t know when (or if) it would have happened.
The Trick: One Row per Person per Time Slice
The key idea comes from discrete-time survival analysis. Chop the timeline into intervals, then expand the data so every individual gets one row for every interval they were observed. Each row asks a simple yes/no question: did the event happen in this interval?
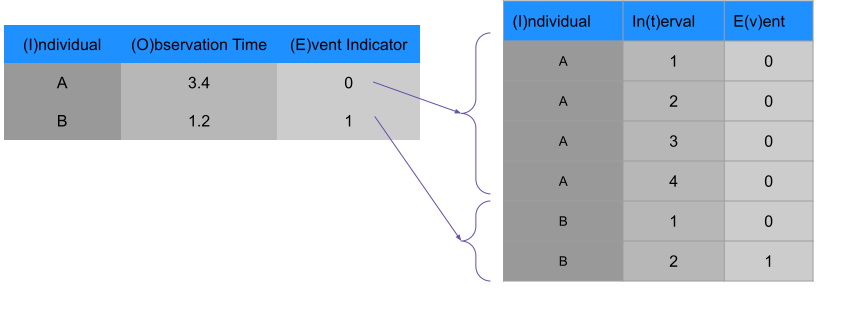
Now the interval is just another predictor alongside the other covariates, and any binary classifier can be the model. Censoring takes care of itself: a censored individual simply stops contributing rows. The classifier’s predicted probability for each interval is a hazard, the chance of the event in that interval given that it hasn’t happened yet. Multiply the survival probabilities interval by interval and you get a full survival curve for each individual.
I didn’t invent this approach. The autoSurv code by Krithika Suresh and colleagues, plus the discrete-time literature, got me there. What spect adds is ensembles and ease of use.
Stack Everything
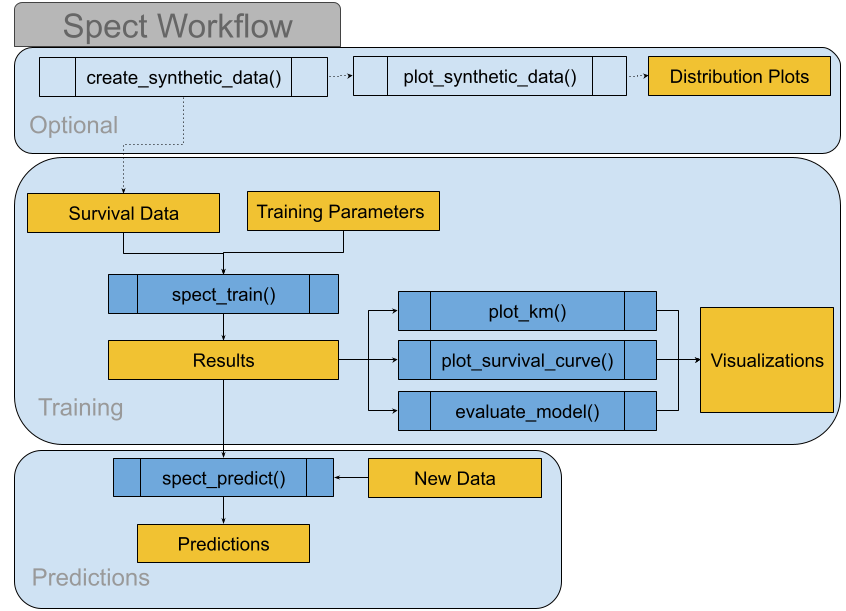
If any classifier works, why pick just one? spect builds on caret and caretEnsemble to train several base learners (say, a GLM and a linear SVM) and then a meta learner (say, a random forest) that learns how to combine their predictions. The whole thing takes one function call:
library(spect)
data(pbc, package = "survival")

pbc_complete <- pbc[complete.cases(pbc), ]
train_data <- pbc_complete[, 7:20]
train_data$event_indicator <- ifelse(pbc_complete$status == 2, 1, 0)
train_data$survival_time   <- pbc_complete$time / 365.25    # years

result <- spect_train(model_algorithm   = "rf",                   # meta learner
                      base_learner_list = c("glm", "svmLinear"),  # base learners
                      modeling_data     = train_data,
                      event_indicator_var = "event_indicator",
                      survival_time_var   = "survival_time",
                      obs_window = 12,
                      use_parallel = TRUE, cores = 3)

plot_survival_curve(result, individual_id = 40)
From there, a handful of helpers cover the rest of the workflow: Kaplan-Meier comparisons, time-dependent ROC curves, and predictions on new data.
So, What Do We Get?
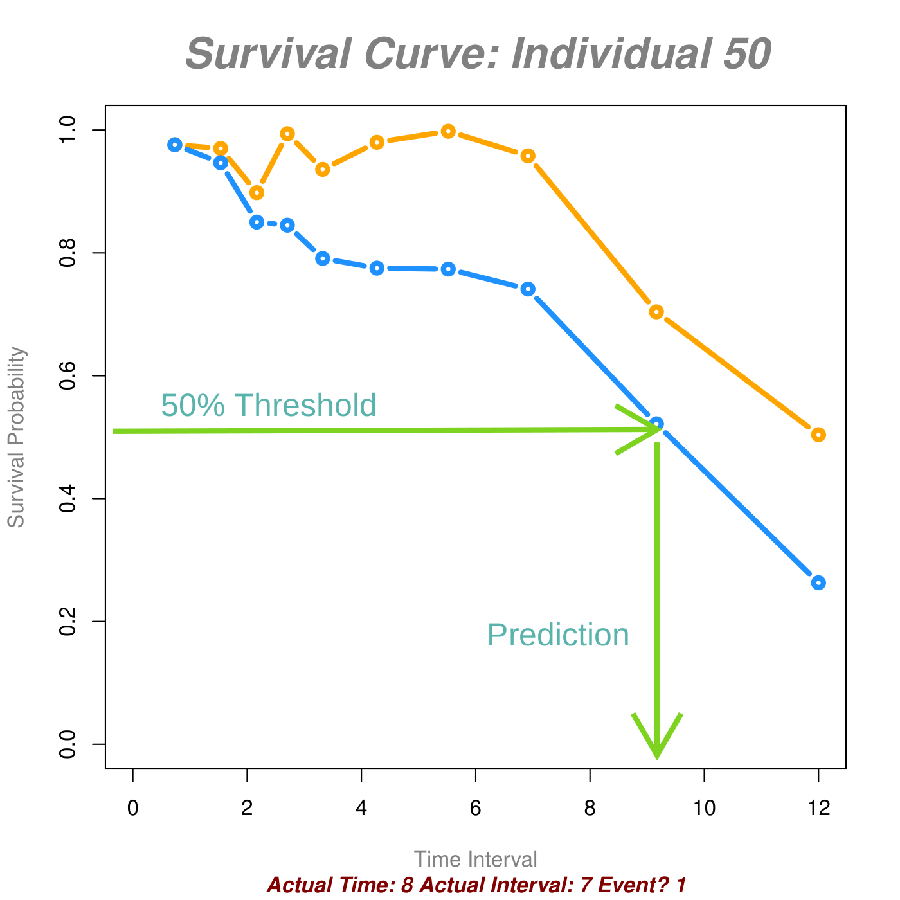
Each individual gets a predicted survival curve. Pick a threshold (say, 50%) and the interval where the curve crosses it becomes the predicted time of the event:
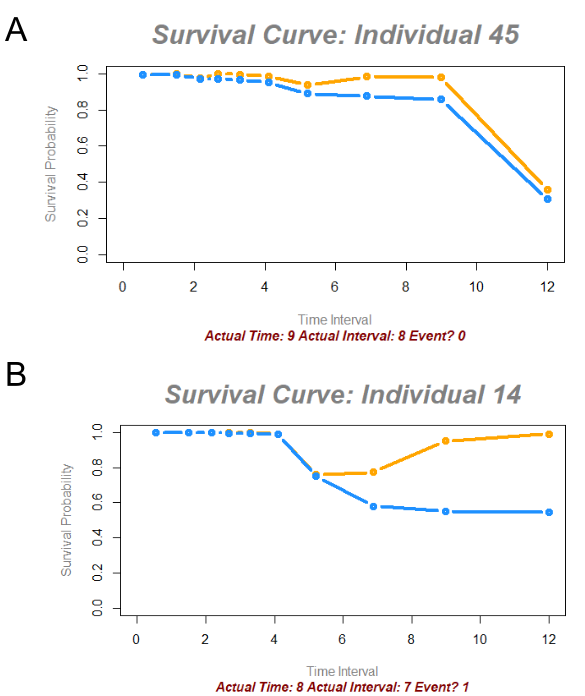
On the Mayo Clinic primary biliary cirrhosis (pbc) dataset that ships with R, I ran 127 trials with random combinations of base learners, meta learner and bin count. They averaged an AUC above 0.75 and a log-rank p-value above 0.73 (here, higher is better: it means the predicted and actual Kaplan-Meier curves are hard to tell apart). The choice of meta learner mattered most. It’s also sensitive to parameter choices, especially on small datasets, which is exactly why making it cheap to try lots of combinations is the point.
Things I Learned Along the Way
- Accuracy is a terrible metric here. With 10 intervals, guessing “no event” for every row is already about 90% accurate. AUC and Kaplan-Meier agreement tell you far more.
- Brute force is underrated. Before the package existed, I ran about 2,500 randomly configured models on synthetic data (time to cancel a streaming subscription, based on income and viewing time) to see what mattered. The radial SVM was the best on average, but every algorithm found at least one configuration that worked well. That’s what convinced me the stacking approach was worth packaging.
- Naming is hard. The original name was detect, but that package already existed, : ).
- CRAN is a gauntlet. The package passed every check on my machine and still went through several rounds of rejection. Highlights: my test data was too large,
predict()quietly changed its behavior in R 4.4.2, and I learned more aboutR CMD checkthan I ever wanted to. It was finally accepted in April 2025. - Save often. I lost an entire notebook in 2023 and had to rebuild it from scratch. (It went faster the second time.)
Thanks to Drs. Herman Frieboes, Dylan Goodin, and Hunter Miller at the University of Louisville for sharing their deep expertise and for their patience with my progress on this project.
Try It
spect is on CRAN, and the code is on GitHub. The package includes vignettes (because CRAN demands that, too) for generating synthetic survival data and training models on it, so you can kick the tires without any data of your own.